Welcome to DU!
The truly grassroots left-of-center political community where regular people, not algorithms, drive the discussions and set the standards.
Join the community:
Create a free account
Support DU (and get rid of ads!):
Become a Star Member
Latest Breaking News
Editorials & Other Articles
General Discussion
The DU Lounge
All Forums
Issue Forums
Culture Forums
Alliance Forums
Region Forums
Support Forums
Help & Search
Environment & Energy
Related: About this forumJames Hansen, Joe Kelly, Pushker Kharecha - Global Warming Acceleration: Impact on Sea Ice
https://www.columbia.edu/~jeh1/mailings/2025/SeaIce.Acceleration.02April2025.pdf
Global Warming Acceleration: Impact on Sea Ice
02 April 2025
James Hansen, Joe Kelly, Pushker Kharecha
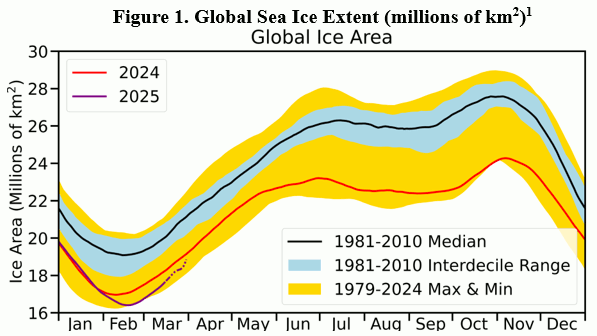
Abstract. Global warming has accelerated.[2] Warming melts sea ice, but it also melts ice sheets, ice shelves, ice caps and glaciers, which affects sea ice cover. Injection of cold freshwater and icebergs into the ocean tends to increase sea ice cover during a transient period until the climate forcing stabilizes and a new climate state is approached. Sea ice melt due to the warming ocean has the upper hand over freshwater injection in both hemispheres today, and thus global sea ice cover is near a historic low (Fig. 1). Arctic sea ice has been relatively stable for the past 10-20 years while Antarctic sea ice has declined, but global warming acceleration may alter both cases. In the Arctic, warm Atlantic water is intruding under the cold Arctic surface layer and warm Pacific water is spilling over the Aleutian sill into the Arctic Basin. Paleoclimate data show that warming at depth can lead to sudden loss of sea ice near Greenland, with consequences for the Greenland ice sheet. In the Antarctic, accelerated ocean warming increases melting of ice shelves and freshwater injection, which can cause temporary growth of sea ice cover. Global climate models employed by the Intergovernmental Panel on Climate Change (IPCC) have failed to account well for the freshwater effect on sea ice cover, thus contributing to IPCC’s underestimate of climate sensitivity. Overall, accelerated global warming does not bode well for stability of the ice sheets, the ocean’s overturning circulations, and global sea level in coming decades – despite the complexity of sea ice changes and uncertainty about the growth rate of ice sheet mass loss.
Global sea ice cover is one of the three big “fast” climate feedbacks in the classical definition of equilibrium climate sensitivity (ECS), which the Charney report[3] cemented. The Charney committee’s decision to exclude the “slow” feedbacks of ice sheets and the carbon cycle in their assessment was invaluable, as it allowed focus on the crucial water vapor, cloud and ice/snow feedbacks, and their interactions, in the global climate models (GCMs) then under development. Charney realized that the excluded feedbacks may have effects on short timescales, but those could be kept in mind for later study.
Recently, we concluded that climate sensitivity is high, ECS = 4.5 ± 0.5°C (1𝛔) for doubled atmospheric CO₂, based on three independent analyses (glacial-interglacial climate change, 1850-2024 global warming, and Earth’s darkening during 2000-2024).[2] High ECS changes everything: it fundamentally alters expectations for continued climate change. Why? Because “fast” feedbacks are not really fast: they come into play in proportion to temperature change, not in direct response to climate forcing. Thus, climate response time is approximately proportional to climate sensitivity squared.[4] One consequence is that the “fast” feedback response to ship aerosol reduction[2] is still growing significantly after five years, which is the reason we expect 2025 global temperature to be about as high as in 2024, despite the El Nino having faded to the ENSO-neutral state. A second result is that we must simultaneously consider “fast” and “slow” feedback effects because their timescales overlap. Let’s start with sea ice.
Fig. 2. Arctic and Antarctic sea ice area (31-day running-mean of daily data) from National Snow and Ice Data Center daily sea ice extent data.[1] The most recent 15 days (shown be a dotted line) are 29-day, 27-day… 3-day, 1-day means, and are thus estimates that will be replaced as data are updated.
Sea ice cover is now near its minimum during the era of global satellite data (i.e., since 1979) in both hemispheres (Figs. 2 and 3). The warm-season minimum of Arctic sea ice decreased sharply in 2007 and even further in 2012. The 2007 decrease was associated with sustained wind anomalies that drove ice from the Arctic toward warmer water and the Fram Strait.[6],[7] The 2012 melt was enhanced by an intense cyclonic storm that mixed heat upward in a normally well-stratified summer ocean, thus melting sea ice from below.[8] As the thickness of sea ice declines, such weather anomalies melt ice more effectively.
…

